This method usually outputs false.
Can you imagine a situation where it outputs true?
static bool Test(out int x, out int y)
{
    x = 123;
    y = 45;
    return (x == y);
}
You can find the solution in .NET Fiddle.
This method usually outputs false.
Can you imagine a situation where it outputs true?
static bool Test(out int x, out int y)
{
x = 123;
y = 45;
return (x == y);
}
You can find the solution in .NET Fiddle.
Recording from the second lesson (27/Feb 2018) of Cloud Applications Development course (NSWI152) for MMF UK (LS 2017/2018). It is publish on our HAVIT YouTube Channel.
Topics covered:
You can find the labs instructions on GitHub (LAB1 + LAB2).
On one of the projects I’m involved in, whatever we wanted to do with our Azure SQL DB (V12), we got this error:
The database ‘tempdb’ has reached its size quota. Partition or delete data, drop indexes, or consult the documentation for possible resolutions. (Microsoft SQL Server, Error: 40544)
As there is not much to do in such situation we asked Microsoft Azure Support for assistance and this is their reply (saved here for further reference):
If you experience the TempDB full issue again, then please leverage the DMVs below and look for active transactions which are taking maximum TempDB space. For a long term fix, I would recommend tuning those queries to use less temp space and if the issue is being caused by multiple queries running concurrently then serialize the workload to not consume all available TempDB space. Here are the queries that will give you insight into which queries are causing this:
Query to get Used and Free Space in TempDB
Note: This can be misleading as it doesn’t include free space up to max sizeSELECT SUM(allocated_extent_page_count) AS [used pages], (SUM(allocated_extent_page_count)*1.0/128) AS [used space in MB], SUM(unallocated_extent_page_count) AS [free pages], (SUM(unallocated_extent_page_count)*1.0/128) AS [free space in MB] FROM tempdb.sys.dm_db_file_space_usage;Retrieving information about which clients (connected to current database) are using TempDB with open transactions
SELECT top 5 a.session_id, a.transaction_id, a.transaction_sequence_num, a.elapsed_time_seconds,
b.program_name, b.open_tran, b.status
FROM tempdb.sys.dm_tran_active_snapshot_database_transactions a
join sys.sysprocesses b
on a.session_id = b.spid
ORDER BY elapsed_time_seconds DESC
Retrieving information about which active tasks (in current database) are using TempDB
SELECT es.host_name , es.login_name , es.program_name,
st.dbid as QueryExecContextDBID, DB_NAME(st.dbid) as QueryExecContextDBNAME, st.objectid as ModuleObjectId,
SUBSTRING(st.text, er.statement_start_offset/2 + 1,(CASE WHEN er.statement_end_offset = -1 THEN LEN(CONVERT(nvarchar(max),st.text)) * 2 ELSE er.statement_end_offset
END - er.statement_start_offset)/2) as Query_Text,
tsu.session_id ,tsu.request_id, tsu.exec_context_id,
(tsu.user_objects_alloc_page_count - tsu.user_objects_dealloc_page_count) as OutStanding_user_objects_page_counts,
(tsu.internal_objects_alloc_page_count - tsu.internal_objects_dealloc_page_count) as OutStanding_internal_objects_page_counts,
er.start_time, er.command, er.open_transaction_count, er.percent_complete, er.estimated_completion_time, er.cpu_time, er.total_elapsed_time, er.reads,er.writes,
er.logical_reads, er.granted_query_memory
FROM tempdb.sys.dm_db_task_space_usage tsu
inner join sys.dm_exec_requests er ON ( tsu.session_id = er.session_id and tsu.request_id = er.request_id)
inner join sys.dm_exec_sessions es ON ( tsu.session_id = es.session_id )
CROSS APPLY sys.dm_exec_sql_text(er.sql_handle) st
WHERE (tsu.internal_objects_alloc_page_count+tsu.user_objects_alloc_page_count) > 0
ORDER BY (tsu.user_objects_alloc_page_count - tsu.user_objects_dealloc_page_count)+(tsu.internal_objects_alloc_page_count - tsu.internal_objects_dealloc_page_count) DESC
Find tempDB data size
SELECT SUBSTRING(st.text, er.statement_start_offset/2 + 1,
(CASE WHEN er.statement_end_offset = -1
THEN LEN(CONVERT(nvarchar(max),st.text)) * 2
ELSE er.statement_end_offset END - er.statement_start_offset)/2) as Query_Text,tsu.session_id ,tsu.request_id,
tsu.exec_context_id,
(tsu.user_objects_alloc_page_count - tsu.user_objects_dealloc_page_count) as OutStanding_user_objects_page_counts,
(tsu.internal_objects_alloc_page_count - tsu.internal_objects_dealloc_page_count) as OutStanding_internal_objects_page_counts,
er.start_time, er.command, er.open_transaction_count, er.percent_complete, er.estimated_completion_time,
er.cpu_time, er.total_elapsed_time, er.reads,er.writes,
er.logical_reads, er.granted_query_memory,es.host_name , es.login_name , es.program_name
FROM sys.dm_db_task_space_usage tsu INNER JOIN sys.dm_exec_requests er
ON ( tsu.session_id = er.session_id AND tsu.request_id = er.request_id) INNER JOIN sys.dm_exec_sessions es
ON ( tsu.session_id = es.session_id ) CROSS APPLY sys.dm_exec_sql_text(er.sql_handle) st
WHERE (tsu.internal_objects_alloc_page_count+tsu.user_objects_alloc_page_count) > 0
ORDER BY (tsu.user_objects_alloc_page_count - tsu.user_objects_dealloc_page_count)+ (tsu.internal_objects_alloc_page_count - tsu.internal_objects_dealloc_page_count) DESC
Checking if tempDB has an active transaction
Examine log_reuse_wait_desc from sys.databases if you see ACTIVE_TRANSACTION this could mean there is a long running active transaction in tempdb that is blocking log flush =>
Check for active transaction on tempDB
select log_reuse_wait_desc, * from sys.databases where name = 'tempdb'

select d.name, d.log_reuse_wait_desc, t.* from sys.dm_tran_locks t inner join sys.databases d on t.resource_database_id = d.database_id
Few more docs about optimizing temp DB –
https://docs.microsoft.com/en-us/sql/relational-databases/databases/tempdb-database
https://technet.microsoft.com/en-us/library/ms175527(v=sql.105).aspx
https://technet.microsoft.com/en-us/library/ms190768(v=sql.105).aspxAdditionally, the higher the pricing tier, your database would have more tempdb space as well.
If you work with Azure SQL or Microsoft SQL Server 2016+, one of the new features there is the Query Store. It stores useful statistics on queries executed, their execution plans, etc. etc.
One of the scenarios you might find useful is the ability to compare queries executed within two periods:
DECLARE @Period1Start datetime, @Period1End datetime, @Period2Start datetime, @Period2End datetime

SET @Period1Start = '20171212 00:00'
SET @Period1End = '20171213 00:00'
SET @Period2Start = '20171214 00:00'
SET @Period2End = '20171215 00:00'

;WITH period1 AS
(
	SELECT
		query_id,
		AVG(avg_duration) AS avg_duration,
		SUM(count_executions) AS count_executions_total
	FROM sys.query_store_runtime_stats
		INNER JOIN  sys.query_store_runtime_stats_interval ON (query_store_runtime_stats_interval.runtime_stats_interval_id = query_store_runtime_stats.runtime_stats_interval_id)
		INNER JOIN sys.query_store_plan ON query_store_plan.plan_id = query_store_runtime_stats.plan_id
	WHERE
		(sys.query_store_runtime_stats_interval.start_time >= @Period1Start)
		AND (sys.query_store_runtime_stats_interval.end_time <= @Period1End)
	GROUP BY query_id
),
period2 AS
(
	SELECT
		query_id,
		AVG(avg_duration) AS avg_duration,
		SUM(count_executions) AS count_executions_total
	FROM sys.query_store_runtime_stats
		INNER JOIN  sys.query_store_runtime_stats_interval ON (query_store_runtime_stats_interval.runtime_stats_interval_id = query_store_runtime_stats.runtime_stats_interval_id)
		INNER JOIN sys.query_store_plan ON query_store_plan.plan_id = query_store_runtime_stats.plan_id
	WHERE
		(sys.query_store_runtime_stats_interval.start_time >= @Period2Start)
		AND (sys.query_store_runtime_stats_interval.end_time <= @Period2End)
	GROUP BY query_id
)
SELECT
		query_store_query.query_id,
		period1.avg_duration AS period1_avg_duration,
		period2.avg_duration AS period2_avg_duration,
		CASE WHEN period1.count_executions_total IS NOT NULL THEN (period2.avg_duration - period1.avg_duration) * 100.0 / period1.avg_duration ELSE NULL END AS avg_duration_increase_percent,
		period1.count_executions_total AS period1_count_executions_total,
		period2.count_executions_total AS period2_count_executions_total,
		CASE WHEN period1.count_executions_total IS NOT NULL THEN (period2.count_executions_total - period1.count_executions_total) * 100.0 / period1.count_executions_total ELSE NULL END AS count_execution_increase_percent,
		query_sql_text
	FROM period2
		LEFT JOIN period1 ON period1.query_id = period2.query_id
		LEFT JOIN sys.query_store_query ON query_store_query.query_id = period2.query_id
		LEFT JOIN sys.query_store_query_text ON query_store_query_text.query_text_id = query_store_query.query_text_id
	--ORDER BY period2.count_executions_total DESC
	ORDER BY count_execution_increase_percent DESC
	--ORDER BY avg_duration_increase_percent DESC
What is the output when you run this code?
try
{
  try
  {
    throw new Exception("A");
  }
  catch
  {
    throw new Exception("B");
  }
  finally
  {
    throw new Exception("C");
  }
}
catch (Exception ex)
{
  Console.Write(ex.Message);
}
See the result: https://dotnetfiddle.net/6SWPqL
If you have ever tried to use Quartz.NET (a famous job-scheduling library) with Castle Windsor (IoC/DI container) you might need to register a component whose life-style should be bound to the job itself (LifestylePerJob). There are plenty of alternatives available which all have the same characteristics – they do not work:
There is a “simple” workaround for such scenarios. You can use LifestyleScoped but you have to begin/end the scope in the job.
If you use the job itself just as a plumbing class where the work itself is encapsulated in a separate service (and you should do this) then you can simply inject both a service-factory and the kernel and then do the scope-work in the job itself:
public class MyJob : IJob
{
    private readonly IServiceFactory<MyService> myServiceFactory;
    private readonly IKernel kernel;

    public MyJob(IServiceFactory<MyService> myServiceFactory, IKernel kernel)
    {
        this.myServiceFactory = myServiceFactory;
        this.kernel = kernel;
    }

    public void Execute()
    {
        using (var scope = kernel.BeginScope())
        {
            // use your way to work with factories ;-)
            using (var myService = myServiceFactory.Create())
            {
                myService.DoWork();
            }
            // BTW: we have an extension method
            myServiceFactory.ExecuteAction(service => service.DoWork());
        }
    }
}
…the MyService class has all the dependencies you need and as you use it using the factory it behaves as the pseudo-resolution-root for this scenario. You might use the kernel.Resolve+Release in the job but I always prefer not to… ;-)
Developers sometimes ask me about “database is not currently available” error when using Azure SQL and Entity Framework 6. In this article I explain why happens this error and how to solve it easily.
Let’s start with the real life example from our customer:
„… we detected an error in our logs: „Database ‘XXX’ on server ‘XXX’ is not currently available.”. It happens usually once a week and sometimes it happens more times during a night. Should we worry about it? We want to move the database from US region do EU and move all databases under elastic pool, so that maybe we do not have to solve this issue now…“
Azure SQL service is a typical PaaS service so that developer doesn’t have to worry about the platform. OS updates, security updates and other things are automatically solved on the provider side. The problem is that sometimes SQL Server reconfiguration is needed and in this case short downtime occurs. It happens during updating OS or when an issue occurred (process or load balancing failure). Most of the downtimes are very short (threshold about 60 seconds). Most of the developers do not know about this issue and just a few developers experienced this error but they do not solve it because the error is exceptional.
If you want to solve this issue, you must implement retry logic. If you use Entity Framework 6 or EF Core, the solution is very easy. Developers in Microsoft know about this behavior and they prepared easy solution in ORMs.
In case of EF 6 you must allow Execution Strategy and choose SqlAzureExecutionStrategy. Complete configuration looks like this:
public class MyConfiguration : DbConfiguration
{
    public MyConfiguration()
    {
        SetExecutionStrategy(
            "System.Data.SqlClient",
            () => new SqlAzureExecutionStrategy(1, TimeSpan.FromSeconds(30)));
    }
}
Source and another information you can find in article:
If you work with EF Core, you can analogicaly configure your project in the place where you register all services.
// Startup.cs from any ASP.NET Core Web API
public class Startup
{
    // Other code ...
    public IServiceProvider ConfigureServices(IServiceCollection services)
    {
        // ...
        services.AddDbContext(options =>
        {
            options.UseSqlServer(Configuration["ConnectionString"],
            sqlServerOptionsAction: sqlOptions =>
            {
                sqlOptions.EnableRetryOnFailure(
                maxRetryCount: 5,
                maxRetryDelay: TimeSpan.FromSeconds(30),
                errorNumbersToAdd: null);
            });
        });
    }
//...
}
Source and another information you can find in article:
As you can see in examples, implementation is a piece of cake.
LogParser (download) is a command line tool from Microsoft which allows you to query any text-based log file using SQL-like syntax. The basic list of supported formats is quite impressive: IISW3C, NCSA, IIS, IISODBC, BIN, IISMSID, HTTPERR, URLSCAN, CSV, TSV, W3C, XML, EVT, ETW, NETMON, REG, ADS, TEXTLINE, TEXTWORD, FS and COM.
I usually use it for querying IIS Log files and believe me it is super-fast. On my Lenovo X1 i7/16GB/SSD it was able to query 8.97GB of log files 2min 12sec!
SELECT
    Date,
    TO_INT(COALESCE(EXTRACT_VALUE(cs-uri-query, 'id'), EXTRACT_VALUE(cs-uri-query, 'SouborSablonyID'))) AS SouborID,
    COUNT(*) AS Total
FROM '[LOGFILEPATH]'
WHERE (cs-uri-stem = '/business/sablony/soubor-partner.aspx') OR (cs-uri-stem = '/business/sablony/soubor.aspx')
GROUP BY Date, SouborID
ORDER BY Total DESC
It is not only able to query the logs but you can use it to push the results to SQL database and many other supported data-sources (CSV, XML, …), e.g.
C:\Program Files (x86)\Log Parser 2.2>logparser “SELECT * INTO iisLogs FROM c:\temp\logs\*.log ” -i:iisw3c -o:SQL -server:localhost -database:MyLogs -username:sa -password:sa -createTable: ON
Note: If you want a plain import of log to DB (without any filtering, projection or aggregation) consider using Import Flat File… wizard from SQL Management Studio for better performance. If you want to use LogParser for feeding your DB, check the transactionRowCount option to batch uploaded rows into single transcation (e.g. -transactionRowCount:-1)
LogParser itself has always been a command-line utility. As an alternative it has a COM API which allows you to use it from your application. This API has been used to produce several GUIs which make the use of LogParser much easier:

You might find following links useful when starting to play with LogParser:
With Visual Studio 2017 being released earlier this year I decided to go for my regular #NoResharper challenge. With every single major version of VS I try to use it without Resharper to find the best setup for me. In general I like the coding productivity boosts Resharper gives me but I hate the way it takes over basic VS features completely and the performance & stability drop it brings. Therefore I regularly try to find a light-weight alternative to R# by using plain VS with only a few reliable extensions.
In the past I used to use Resharper heavily – it was definitely a “must-have” with Visual Studio .NET and Visual Studio 2003. The VS 2005 came with refactorings and I was satisfied working without Resharper till VS2013 when I gave R# another try. There were so many useful productivity boosts not covered by Visual Studio itself or any other stable and light-weight extension (unbeatable T-navigation, Go to definition, Introduce and initialize a field from constructor parameter, Adjust namespaces, etc.). R# returned to my box to better support modern development techniques (IoC/DI, unit-testing, …).
With Visual Studio 2017, it’s improved T-navigation (Go to…), with the help of Roslyn-based refactorings (e.g. Roslynator) and continual updates with new productivity improvements I decided to go without Resharper and after 10 months I can confirm I’m still happy with this decision.
My current Visual Studio setup consists of:
When I check this list of extensions it really seems I might be able to live with plain VS without any major pain! The biggest surprise for me came when I was gathering these items from VS and realized that the Roslynator extension is disabled. (I disabled it after installing the VS2017 15.3 update to test the new Refactorings, Code Generation and Quick Actions.)
UPDATE: If you miss CamelHumps, you might give the Subword Navigation extension a go.
Virtual Networks and Virtual Network Interfaces in Azure could have own Network Security Groups. Every group consists from security rules which enable or disable traffic by defined rules. In some cases we want to disable outbound traffic to the internet but unfortunately this means we disable traffic to various Azure services which are out of our virtual network. In this article I’ll explain how to solve this issue in a few steps.
NSG (Network Security Group) is a security rule set. Every isolated security rule enable or disable traffic based on the configuration. Configuration consists from IP address and protocol or kind of service (Virtual Network, Internet, Load Balancer). There are some examples on the image below:

All the rules are applicated by their priority (higher numbers are applied first). Your own security rules you can define with priority 0-4096. At the end of the rules set we can see Default Rules which are defined everytime and they have significantly lower priority (priority 60000 and higher).

This Default Rules cannot be deleted neither changed but logically they can be overrided by another rules with higher priority. See the example below. Default rule with low priority is overriden by custom rule. This is good example how to disable all the outbound traffic to the internet.

The rule set (NSG) is applicable to Virtual Networks or Virtual Network Interfaces (NIC). In the real world we apply the rule set for the whole Virtual Network together with specific rules for Virtual Machines (each Virtual Machine can only have one NIC).
Ideally we could create Virtual Network and disable all the outbound trafic to the internet. The problem is that most of the Azure services could not be assigned to our Virtual Network (they are available on the internet) so that we cannot disable all the trafic. Fortunately we can apply a few rules:
It seems to be easy but the problem is we never know which IP addresses will have Azure Services assigned. We usually do not care about it because we typically use just DNS. The best solution is to allow outbound traffic to all the IP addresses of all the Azure Services. List of all IP ranges we can download as XML:
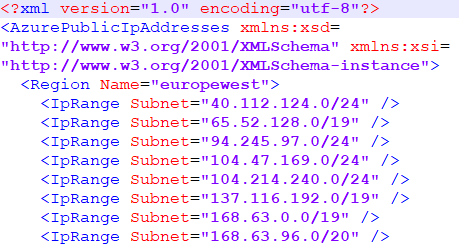
There is another issue we have to solve. NSG has restriction for maximum of 200 security rules and the West Europe region use over 400 IP ranges. It means we must contact Microsoft Azure Support and request for increasing limit. Finally, Microsoft allows us to manage 500 security rules. More about Azure limits you can read on:
How to add over the 400 security rules? By hand? Nooo.. IP Ranges could change and we need to automate. And right now we need Azure Powershell. With accomplishing this challenge helped me article from Keyth Mayer:
His solution is interactive script and a wizard which creates rule set based on user input. In my case I needed change the behavior and support simple requirement: to be able to run script recurently with well known configuration using the VSTS Release Management. As the trigger I decided to use simple timer scheduler.
From the high-level perspective the solution is easy:
How the algorithm works? First I delete all the rules created previously by automation, then I download new XML file with IP address ranges and finaly I add all the IP address ranges as a set of new rules. It means that NSG is never changed (just the rules inside). Update of the NSG is fired in the end of the script so that I do not have to be afraid of issues and unsuccessful partial update. The final script follows here:
$subscriptionId = 'xxx'
$nsgName = 'xxx'
$rgName = 'xxx'

Select-AzureRmSubscription -SubscriptionId $subscriptionId
$nsg = Get-AzureRmNetworkSecurityGroup -Name $nsgName -ResourceGroupName $rgName

# Download current list of Azure Public IP ranges
$downloadUri = "https://www.microsoft.com/en-in/download/confirmation.aspx?id=41653"
$downloadPage = Invoke-WebRequest -Uri $downloadUri -UseBasicParsing
$xmlFileUri = ($downloadPage.RawContent.Split('"') -like "https://*PublicIps*")[0]

$response = Invoke-WebRequest -Uri $xmlFileUri -UseBasicParsing

# Get list of regions & public IP ranges
[xml]$xmlResponse = [System.Text.Encoding]::UTF8.GetString($response.Content)

$regions = $xmlResponse.AzurePublicIpAddresses.Region

#$selectedRegions = $regions.Name | Out-GridView -Title "Select Azure Datacenter Regions ..." -PassThru
$ipRange = ( $regions | where-object Name -In "europewest" ).IpRange

$rulePriority = 300
$counter = 1

ForEach ($rule in $nsg.SecurityRules | where-object Direction -Eq 'Outbound') {
    If($rule.Name -like '*AllowAzureOutbound_*'){
        Remove-AzureRmNetworkSecurityRuleConfig -Name $rule.Name -NetworkSecurityGroup $nsg

        Write-Host("REMOVED NSG RULE " + $rule.Name)
    }
}

ForEach ($subnet in $ipRange.Subnet) {

    $rulePriority++
    $counter++

    $ruleName = "AllowAzureOutbound_" + $subnet.Replace("/","-")

    $nsgRule = New-AzureRmNetworkSecurityRuleConfig `
            -Name $ruleName `
            -Description "Allow outbound to Azure $subnet" `
            -Access Allow `
            -Protocol * `
            -Direction Outbound `
            -Priority $rulePriority `
            -SourceAddressPrefix VirtualNetwork `
            -SourcePortRange * `
            -DestinationAddressPrefix "$subnet" `
            -DestinationPortRange *

    $nsg.SecurityRules += ,$nsgRule

    Write-Host("ADDED NSG RULE " + $subnet)

    If ($counter -gt 490)
    {
        break
    }
}

If (!$error) {
    Set-AzureRmNetworkSecurityGroup -NetworkSecurityGroup $nsg
} else {
    Write-Host("NOTHING CHANGED BECAUSE OF ERROR")
}
I am not a PowerShell guru and probably the script could be written more elegantly and efficiently.
My Release Definition consists from one environment with one single step (Azure PowerShell task). This task connects to Azure Subscription and runs the script from step 1.

It looks nice but there is a small catch. Current version of Azure PowerShell allows to create inline script with max length 500 chars. We have to hack a bit: open developer console in favorite browser and break the client validation.
 HAVIT Knowledge Base